The True Cost of CRM
The strategic economic issue for all CRM initiatives must be their cost/benefit relationship. Put simply: How can we determine how much we can afford to spend on CRM activities for a single customer or group of customers to produce what level of loyalty and/or incremental business? And can we justify the huge technology expenditures that are needed to develop truly integrated marketing databases?
Putting the technology investment to the side for the moment, the first consideration is how much we can afford to spend on CRM for an individual customer. This is best considered by focusing on three factors:
*An estimate of the revenue and profit likely to be earned form the customer without any CRM activity.
*An estimate of the incremental revenue and profit likely to be earned from the customer with CRM activity and at what cost.
*An estimate of how much it would cost to replace this customer with a similar one.
While the inputs for these calculations demand a number of assumptions, these can be modeled (see Exhibit 1) to produce, if not a flawless formula for CRM economics, at least a powerful analytical tool that should inform decision-making and permit the consideration of a wide range of “what ifs.”

We start, as usual, with the original ACPO. That’s what the marketer paid to acquire this customer in the first place and should include a mandated rate of contribution and profit. Next are the actual cost and any difference from the ACPO. A positive difference (in this case 20.00) is important because it adds to the bottom line over and above the mandated rate of contribution and profit. Adding this into the total profit without the CRM program elevates the percentage of profit on this customer from an assumed 20% to 25%.
The next task is to calculate the estimated revenue from the customer over a number of time periods. It is always wise to be conservative in estimated revenue—guessing low only enhances the final profit if you have been overly conservative. Since the marketer expects to make a profit on this incremental revenue, it is necessary to input the desired percentage. In this example, we have used 20%, which has been entered as the input for “Estimated Contribution or Profit with CRM program.”
If this were all there was to the calculation, we would have a lifetime “Contribution or Profit Assumption” of 100.00 (the sum of 80.00 of profit on revenue of 400.00 at 20% plus the 20.00 positive difference between the ACPO and the CPO) and that would be that.
The economic purpose of CRM activities is to enhance the customer relationship, resulting in increased revenue and profit. The same issue conditions all CRM investments.
What we are trying to determine here is how much to invest in CRM activities to gain how much additional sales and profit. And is this expenditure likely to deliver a greater benefit than going out and acquiring a new customer, a cost we have estimated at the same level as the initial acquisition, 60.00, although experience should dictate whether this figure should be higher or lower.
To arrive at the CRM expenditure determination, we now have to make some further assumptions. With a successful CRM program, incremental revenue and profit should be generated from the customer both from a longer-term relationship than without CRM and from an increased level of sales during the initial period in excess of the non-CRM forecast.
Without CRM, we estimated four Revenue Periods, each producing 100.00 of revenue. Our CRM assumption adds an additional three periods. But as a result of the CRM activities, we also estimate a rise in revenue of an average of 30.00 per period for each of the seven periods. If we further assume that the profit on this incremental revenue will be 20%, we add an additional 82.00 to the 100.00 we had without the CRM program, giving a total of 202.00.
Retention or Acquisition?
To have a CRM program costs money and anything we spend will reduce the 202.00 “Lifetime Contribution or Profit Assumption with CRM Program” shown in Exhibit 2. Thus, the decision of how much we can afford to spend,, stated as a percentage of the 102.00 incremental contribution or profit, is dependent upon whether this will provide enough money to mount an effective CRM program or whether we would be better advised to sue the money to acquire new customers.

For the purpose of this example, we have assumed we’ll spend 40% of the incremental profit of 102.00 or 40.80. Since we also have a 20.00 positive difference between the ACPO and CPO, it is reasonable to use it all for additional CRM funding. This gives us a total of 60.80 per customer to spend on CRM and reduces the profit from 202.00 to the 141.20 as shown in Exhibit 3. If all our assumptions are correct, the comparison of the initiative with and without a CRM program shows increased revenue and profit with the CRM program, although the percentage of profit is lower with the CRM program than without it.

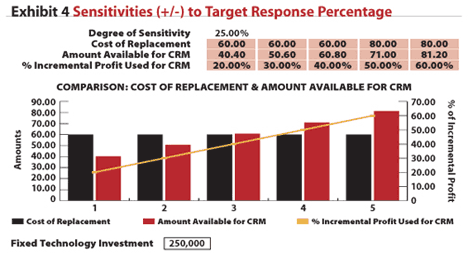
Since we are seeking to determine whether it is better to invest in CRM (and if so, how much to invest) or alternatively, to invest in the acquisition of a new customer, we need to review the sensitivities in Exhibit 4.

The key is the percentage of the “Incremental Profit” that can be economically used for CRM. The graphic makes it obvious that below 40%, using the “Amount Available for CRM” to fund a CRM program is a better bet than trying to acquire new customers is economically better. This applies only to the example and might be a very different percentage given other inputs.
If the performance of all customers were equal, then our next step would be to try and determine how much of a CRM program we could mount for approximately 60.80 per person. However, we know that this is too simplistic. We therefore need to divide our customer base into value segments and apply the same methodology to each segment.
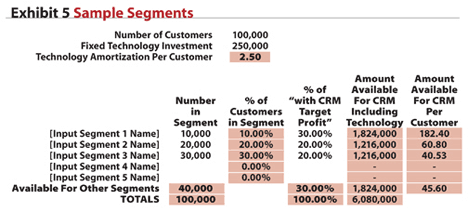
As can be seen in Exhibit 5, the total base of 100,000 customers has been divided into five segments. For each segment, the percentage of customers assumed to be in each segment is entered in the “% of CRM Target Profit” boxes. The assumption is that a certain percentage of the customers will perform better than the average computed in the model: the best segment is allocated 30% of the calculated average amount available for CRM—and at descending percentages the other segments receive less, with the last two segments getting no investment at all.

The result shows a total of 6,080,000 available to spend for CRM but much more interesting is the amount available to spend for each segment and the “Amount Avail. For CRM Per Customer.” Deducted from this amount is the total amortization of 250,000 for fixed technology applied to each customer. The final column shows us the amount of money available for the tactical CRM actions for each segment: 182.40 for the best customer segment, 10% of the customers, 60.80 for the next 20%, 40.53 for the third segment of 20%, for the rest if the marketer decides to spend it. The decision to spend money on the rest of the customers is based on determination of value.
With both the macro and micro view of the CRM economics, it should be possible to fashion a tactical program for all or some of the customers or at the very least, determine if there is enough money available to make such a program worthwhile.
From Accountable Marketing, The Economics of Data-Driven Marketing 1st edition by ROSENWALD. Copyright 2004. Reprinted with permission of South-Western, a division of Thomson Learning: www.thomsonrights.com. Fax 800-730-2215. Copies are available online at: http://www.racombooks.com.


