It’s no surprise that the recession and slow-moving economy over the last three years have prompted manufacturers to increase coupon distribution and coupon clippers to ramp up their search for discounts. The economy and the flood of coupons have also brought untold numbers of new buyers into the fold. However, after increases from 2007 to 2010, distribution, savings values and redemption have taken a dip, but remain higher than pre-recession time periods, according to a new study.
“You had record breaking years in 2009 and 2010 so that certainly set the stage for marketers to pull back a little bit,” Charles K. Brown, vice president of marketingat NCH Marketing Services, said.“In the fall of 2010, expectations for the economy were better than what actually played out, so marketers planned for needing a little less coupon activity. Couple that with the fact that redemption was so strong, marketers needed to pull back in distribution quantities to manage their budgets.
Face value
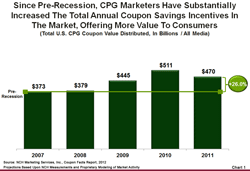 In the consumer packaged goods category, last year marketers offered $470 billion in coupon value to U.S. consumers, down from $511 in 2010, yet well above the $373 2007 pre-recession savings. Health and beauty care (HBC) put $263 billion in value out in the marketplace, basically flat with $265 billion in 2010, according to the 2012 Coupon Facts Report from NCH.
Distribution
Distribution dropped 8.1% to 305 billion from 332 billion in 2010, attributed entirely to fewer coupons in the grocery segment as the economy was projected to be on the upswing. HBC distribution was unchanged from 2010 at 126 billion.
CPG marketers continued to allocate the greatest share of coupons via FSIs (89.4%), followed by in-store handouts (4.2%), direct mail (2.3%), magazines (1.5%) and in/on pack (1.1%). HBC followed suit with 91.8% distributed through FSIs, 2.5% handouts in store, 2.1% in direct mail offers, 1.7% via magazines and 0.3% tucked into in/on pack promotions, the study found.
Redemption
Shoppers took advantage of the offerings, redeeming $4.6 billion in savings, an increase of 12.2% over 2010. That equates to 3.5 billion coupons, up 6.1% from 2010 and 34.6% since 2007.
“Coupons play an important role in helping brands defend and grow market share in the face of competitive threats, including private label brands. In addition, the advertising value of coupons and the opportunities they create for merchandising tie-ins can help increase brand awareness and motivate purchases that do not involve the use of a coupon,” the report stated.
In fact, the study found that 80.6% of consumers used coupons regularly last year, up 17% from 2007, an indicator that consumers were still looking for discounts. Media coverage, TV shows and retailer support and local promotions helped raise awareness of the offers.
Marketers offered the coupons depending on their own strategic objectives. They bucked trends, altered course as the year wore on and changed promotional strategies and coupon tactics all to meet consumer demand. Of note was that CPGs reduced the number of coupons they made available, but maintained year-over-year redemption volume with suppressed offers. Meanwhile, HBC marketers maintained volume and achieved a 200 million increase in redemption. Also of interest in 2011, was that during the second half of the year redemption grew 9.2% even as coupon distribution shrunk by 10.4%.
Marketers also made modifications in three major ways to balance that consumer demand, the study found.
1. Expiration: Marketers shortened duration periods when they were promoting frequently like in FSIs, compared to double that for in-store media and close to a year for in- or on-pack offers. Last year, the average duration was 9.9 weeks, down from 10.4 weeks in 2010. Overall last year, 89.4% of all coupons were distributed via FSI formats, including co-op, solo and shared mail.
2. Face value: The average $1.54 face value offered remained the same as in 2010 with grocery cutting 3 cents off the average value to $1.17 and HBC coupons averaging $2.09. Within those segments, however, the trends don’t all follow the same pattern. Some marketers increased the discounts available to consumers. The resulting $1.54 average face value across the CPG industry was 17.6% higher than the pre-recession savings offered on coupons in 2007.
3. Purchase requirements: Last year, 27% of coupons distributed required multiple item purchases, up 2 points from 2010. This was achieved by reducing the volume of single purchase coupons distributed by 10.4% overall.
Digital delay
Digital couponing still lags far behind printed versions. Digital coupons grew with 11% more print-at-home and paperless offers, yet the total number of coupons in these formats doesn’t yet exceed 1% of all coupons distributed in the U.S.
What can marketers expect going forward?
“We’re seeing a lot of growth in the FSI and digital media and I think we will see marketers continue in this period of economic slow growth to reach a lot of people and to reach people in new ways,” Brown said.